Scaling vLLM to Zero with KEDA on GKE
In the previous article I built a basic Kubernetes stack on GKE that deploys vLLM on a GPU node to serve models, and I went deep into the pricing side of that stack. Spot prices are attractive, but their availability is very limited.
I want my small code assistant to cost less for this PoC. On enterprise-grade stacks, efficiency and pricing are usually the decision drivers.
I could destroy the entire stack every time, but that means waiting a long time and reconfiguring everything from scratch on each run.
Scaling the GPU down to zero while keeping the cluster alive is the cheapest option that fits this constraint. It is not the simplest one: destroying the stack or a plain scheduled scale-down would be simpler, and the price here is a slow first request. But the idle cost becomes negligible compared to always-on GPU pods, and it is honestly fun to play with. The full implementation lives on my public repo: iheb24/vllm-gke.
The plan: KEDA and the HTTP add-on
KEDA handles this use case brilliantly, and it has become the go-to choice for developers on enterprise and production-grade solutions. KEDA is an event-driven autoscaler: it acts on external metrics instead of compute resources like CPU or memory, and it scales only the number of pods. It supports sources such as:
- queues
- cron schedules
- monitoring systems (Datadog / Prometheus)
- databases
On my simple single-pod stack, I will add KEDA scaling to the cluster. My goal is to scale to zero when the pod is not used.
One way to measure usage is the number of incoming requests. I could technically connect a queue to KEDA to monitor this, but classic queues push us into an asynchronous flow. There is a simpler option for this use case: the KEDA HTTP add-on. It installs an interceptor in the cluster that listens to and proxies all incoming requests, and it exposes the scaling metrics as well, including the number of pending requests.
The interceptor acts as a proxy. It forwards the request to vLLM when pods are ready, or holds it while KEDA scales the deployment up from zero and the cluster autoscaler provisions a GPU node.
What a cold start costs
I implemented this strategy on the repo so I can keep the cluster up for several days and start the assistant quickly when needed. Quickly is very relative here, because a GPU model does not wake up instantly.
A full cold start takes about 4 minutes and splits into five clear phases:
| Phase | Time window | What happens |
|---|---|---|
| 1. The trigger | 0 to 5s | The request hits the KEDA proxy. The queue shows 1 pending request, so KEDA tells Kubernetes to scale the vLLM Deployment from 0 to 1. The pod is created but stays Pending, because no GPU machine exists. |
| 2. Hardware provisioning | 0.5 to 2.5 min | The longest delay. The GKE cluster autoscaler detects the Pending pod and asks the Compute Engine API for a new g2-standard-8 VM. Google Cloud finds capacity in europe-west4-a, boots the VM, installs the NVIDIA drivers, configures networking, and attaches the node to the cluster. |
| 3. Storage and image | 2.5 to 3 min | The pod is scheduled. The 50GB Persistent Disk with the cached model weights is attached to the new machine, and the multi-gigabyte vllm/vllm-openai image is pulled. |
| 4. Model loading and VRAM allocation | 3 to 4 min | The container starts. vLLM reads the 14B Qwen model from disk and copies it over the PCIe bus into the L4's VRAM, then profiles the remaining VRAM and carves it into PagedAttention KV cache blocks. The API server starts and /health goes green. |
| 5. The response | ~4 min | The interceptor sees the health check pass, releases the request it has been holding for 4 minutes, and streams the answer back to the IDE. |
One thing already helps a lot here: a cold node would normally also download the model, which takes time as well. We solved this in the previous article by adding a 50GB Persistent Disk that stores the model weights. The disk is simply detached and re-attached between machines, which is a huge time gain.
All these timings must be measured for your specific model, because they shape the scaling strategy for your use case. KEDA is only a scaler. It reacts to metrics, but we are responsible for the strategy, and the strategy always comes from the constraints we face.
On enterprise-grade stacks, availability is a must. Since starting a pod can take several minutes, the strategy must include idle ready pods to meet the availability constraint, then scale based on pending requests and other metrics. For personal use, firing a request and waiting a few minutes the first time is not really a headache, especially given the savings that scale-to-zero brings.
All of this is configurable in KEDA to get the exact scaling behavior you want. It is also worth noting that a zonal Kubernetes deployment reduces the cost of the stack even further for personal use.
| Component | Enterprise (Regional, Always-On) | Personal (Zonal, Scale-to-Zero) |
|---|---|---|
| GKE Control Plane | $73.00 (Regional HA) | $0.00 (Zonal Free Tier) |
| System Nodes | $147.00 (3x e2-standard-2) | $49.00 (1x e2-standard-2) |
| GPU Node (L4) | $600.00 (1x g2-standard-8, 24/7) | $0.00 (Scaled to 0) |
| Model Storage | $2.50 (50GB Persistent Disk) | $2.50 (50GB Persistent Disk) |
| Total Idle Cost | ~$822.50 / month | ~$51.50 / month |
| Active Usage (20 hrs) | (Included in base cost) | $17.00 (~$0.85 / hr) |
| Final Monthly Bill | ~$822.50 | ~$68.50 (91% Savings) |
Note: Personal idle costs can be further reduced to ~$15/month by using Spot pricing for the single system node. The enterprise projection above is based on the same stack, tested for a few hours and extrapolated to establish a monthly baseline.
For a few days of usage, this is very significant for personal use.
Implementation changes
Implementing this strategy on the vllm-gke repo required some changes. The first easy one was moving the manifests to Helm format for easier usage.
On the cluster, a new node is added to host KEDA and the interceptor. On the manifests, several changes were made, starting with a readiness probe so Kubernetes knows when vLLM is ready, based on the /health route already exposed by the server.
readiness-probe.yaml
This route signals that the vLLM server is ready. The server can still hit errors or crash during execution. When this route returns 200 for the first time, Kubernetes knows the pod is ready and KEDA can pass requests to it. Technically, the first requests the vLLM server receives are the health checks, before KEDA lets real traffic through.
Scaling to zero is best done with the KEDA HTTP add-on. Prometheus metrics, queues, memory, and CPU are all absent when no machine is running, so KEDA has no signal to know when to wake up the GPU. With the HTTP add-on, we deploy an HTTPScaledObject with the following configuration. We scale to one GPU max, and the cooldown is 5 minutes based on the requests captured by the proxy.
keda-scaledobject.yaml
Watching it work
The result is fun to watch. After deploying the new KEDA node and setting up the IP, the API key, and the port-forward proxy as described in the previous article, I started by sending a request to the cluster with curl. The call stayed hanging. Immediately on the vLLM node we can see a new pod being provisioned.
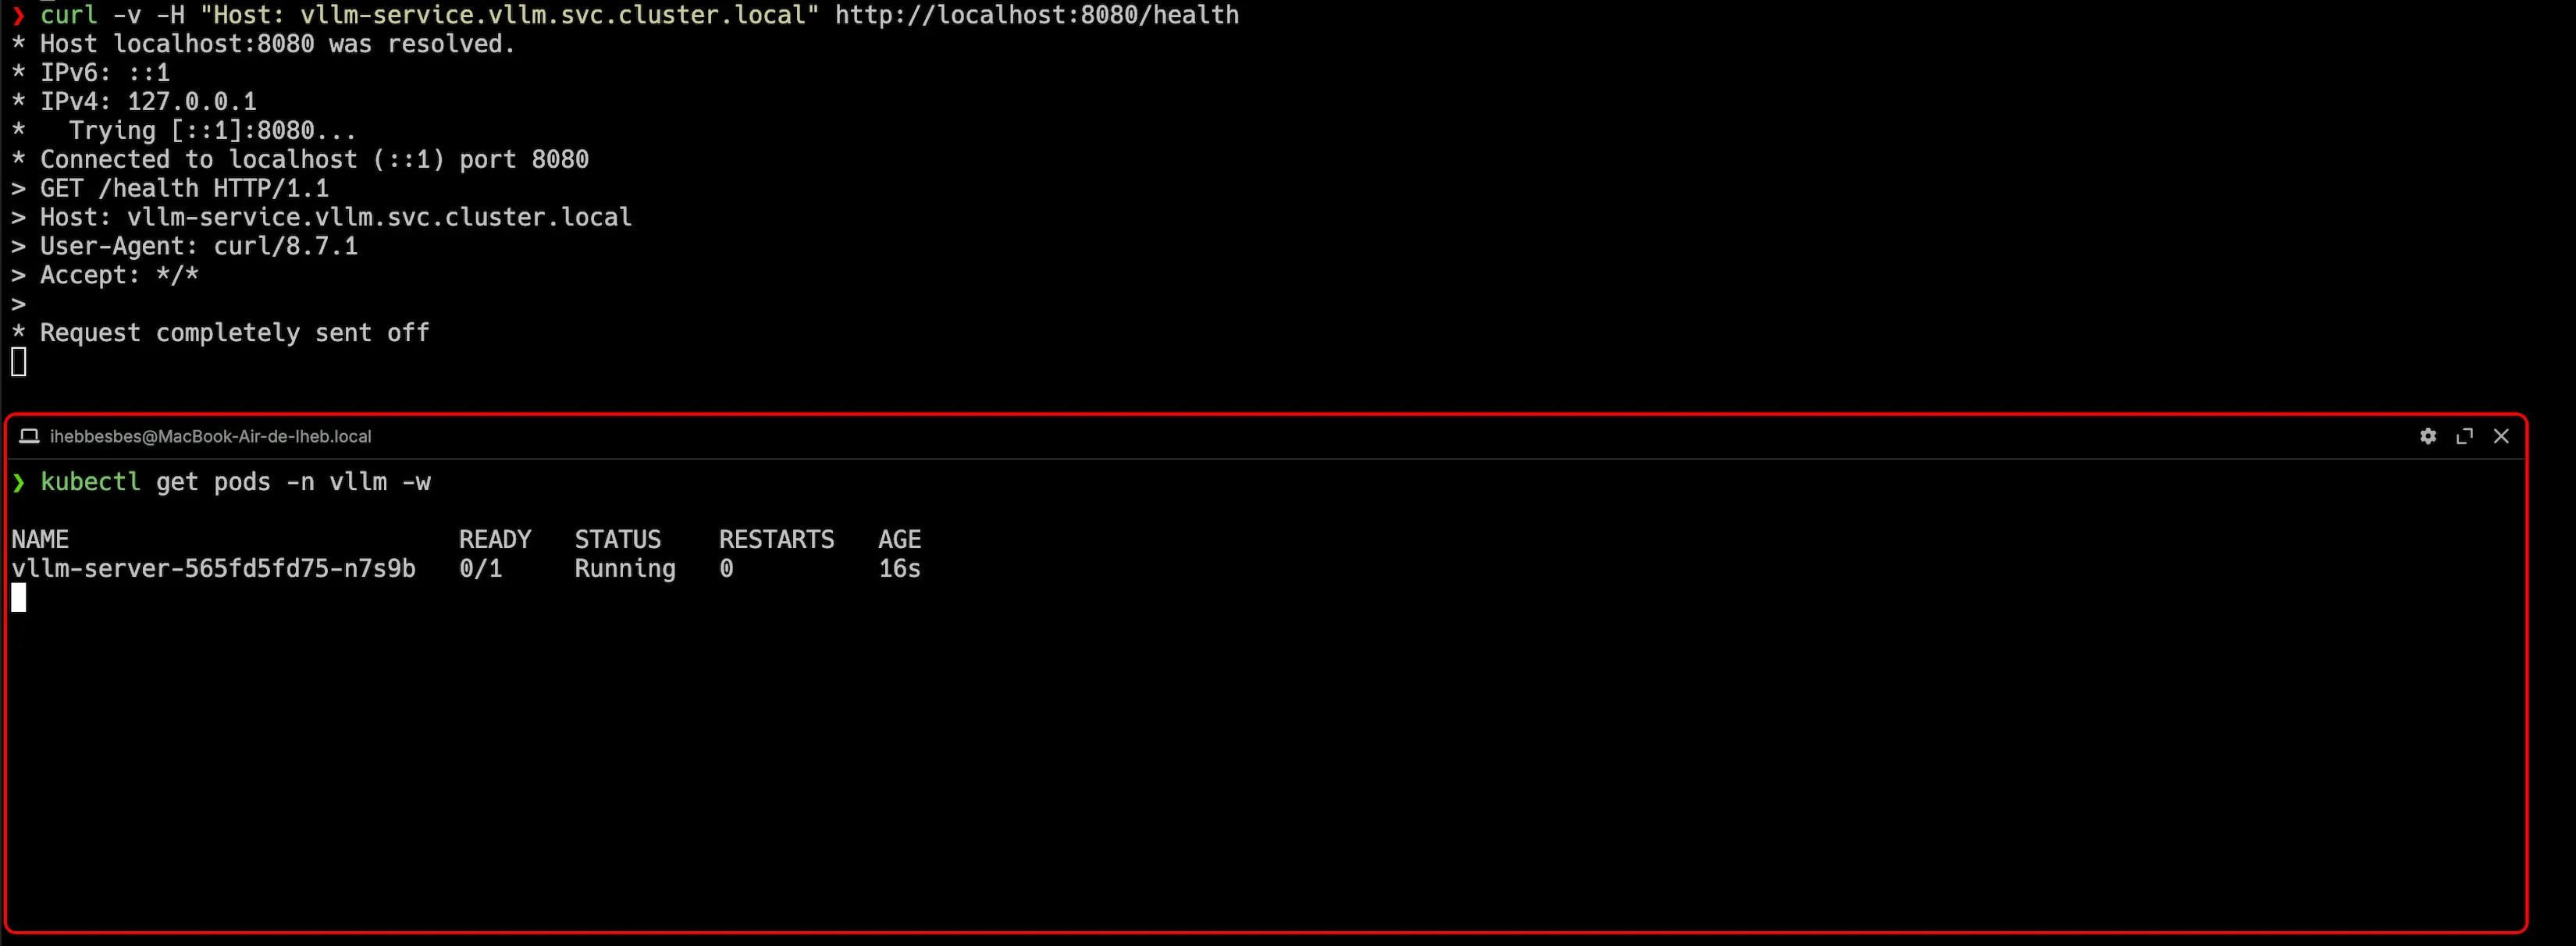
After a little while the machine becomes ready. The health route answered 200, and the curl call was delivered about 3 minutes later, basically one second apart, which lines up with the cold start phases above. The response header confirms that the machine was on a cold start: X-Keda-Http-Cold-Start: True.
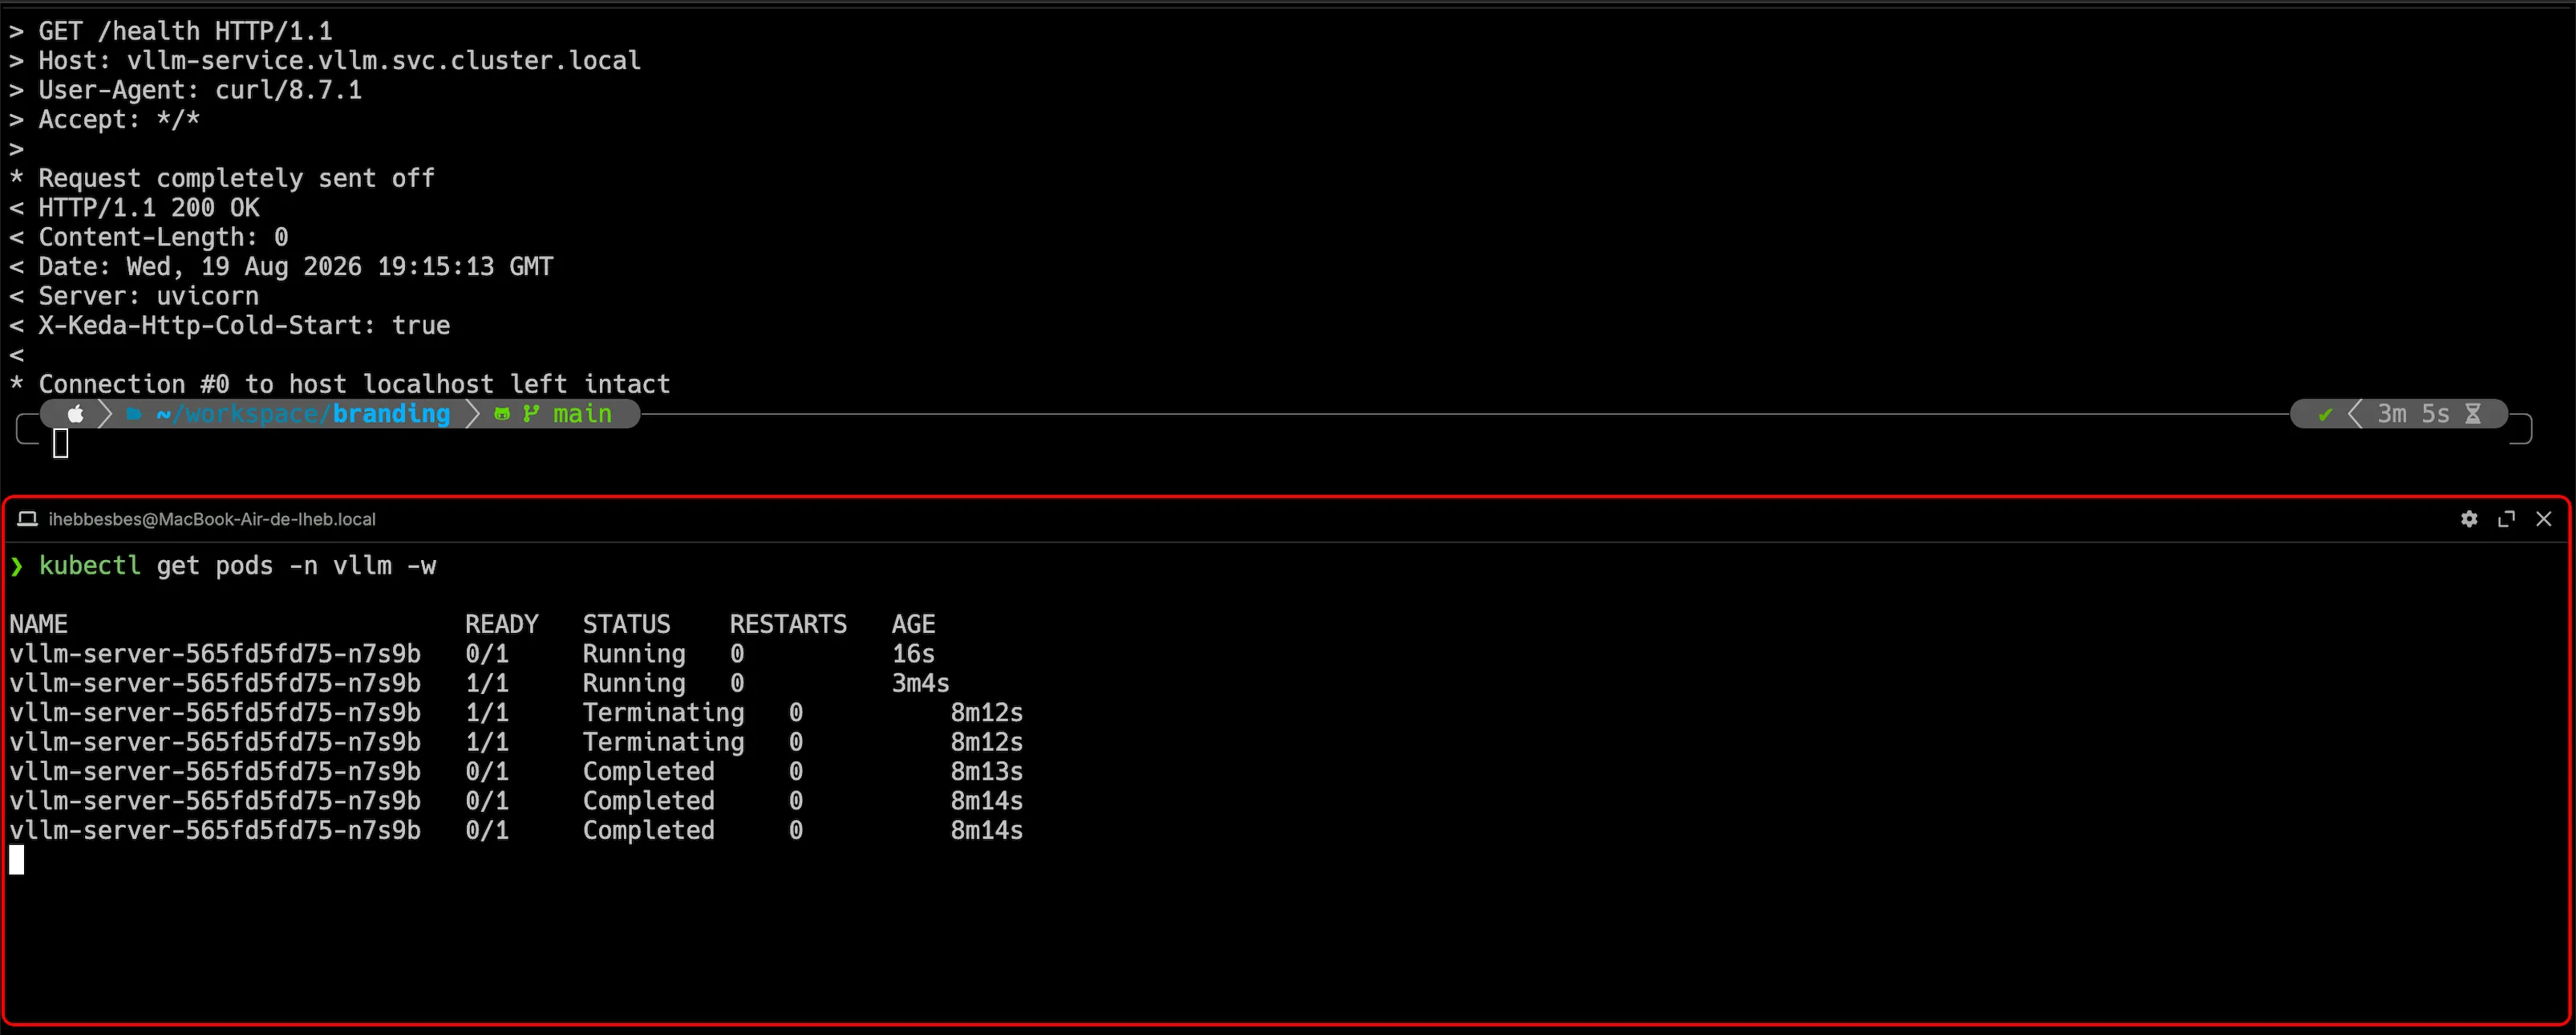
After 5 minutes and 8 seconds, the machine started terminating since no other request was fired to the GPU.
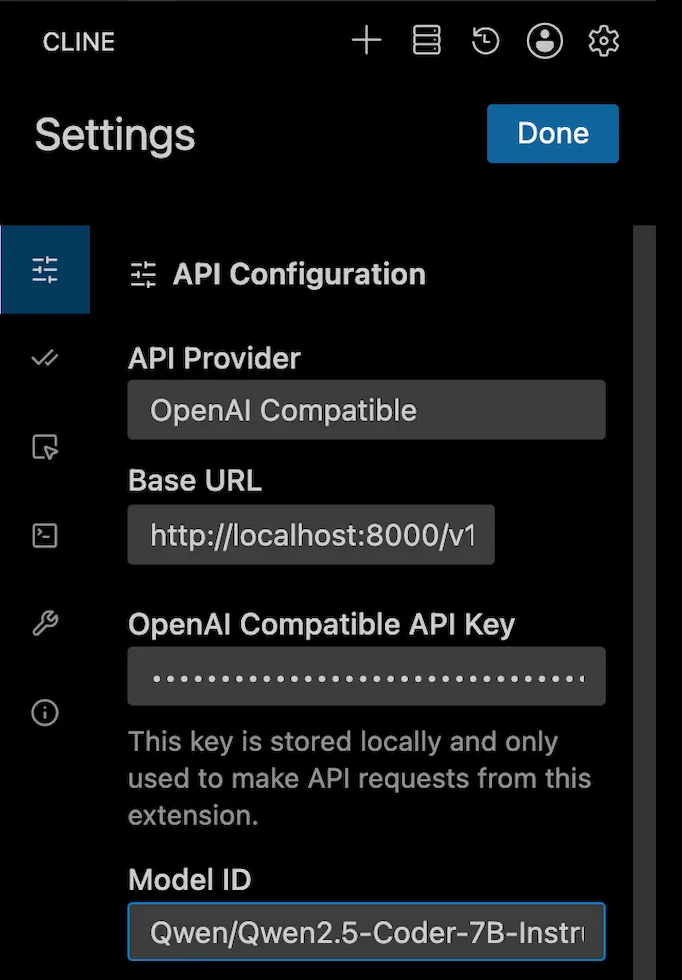
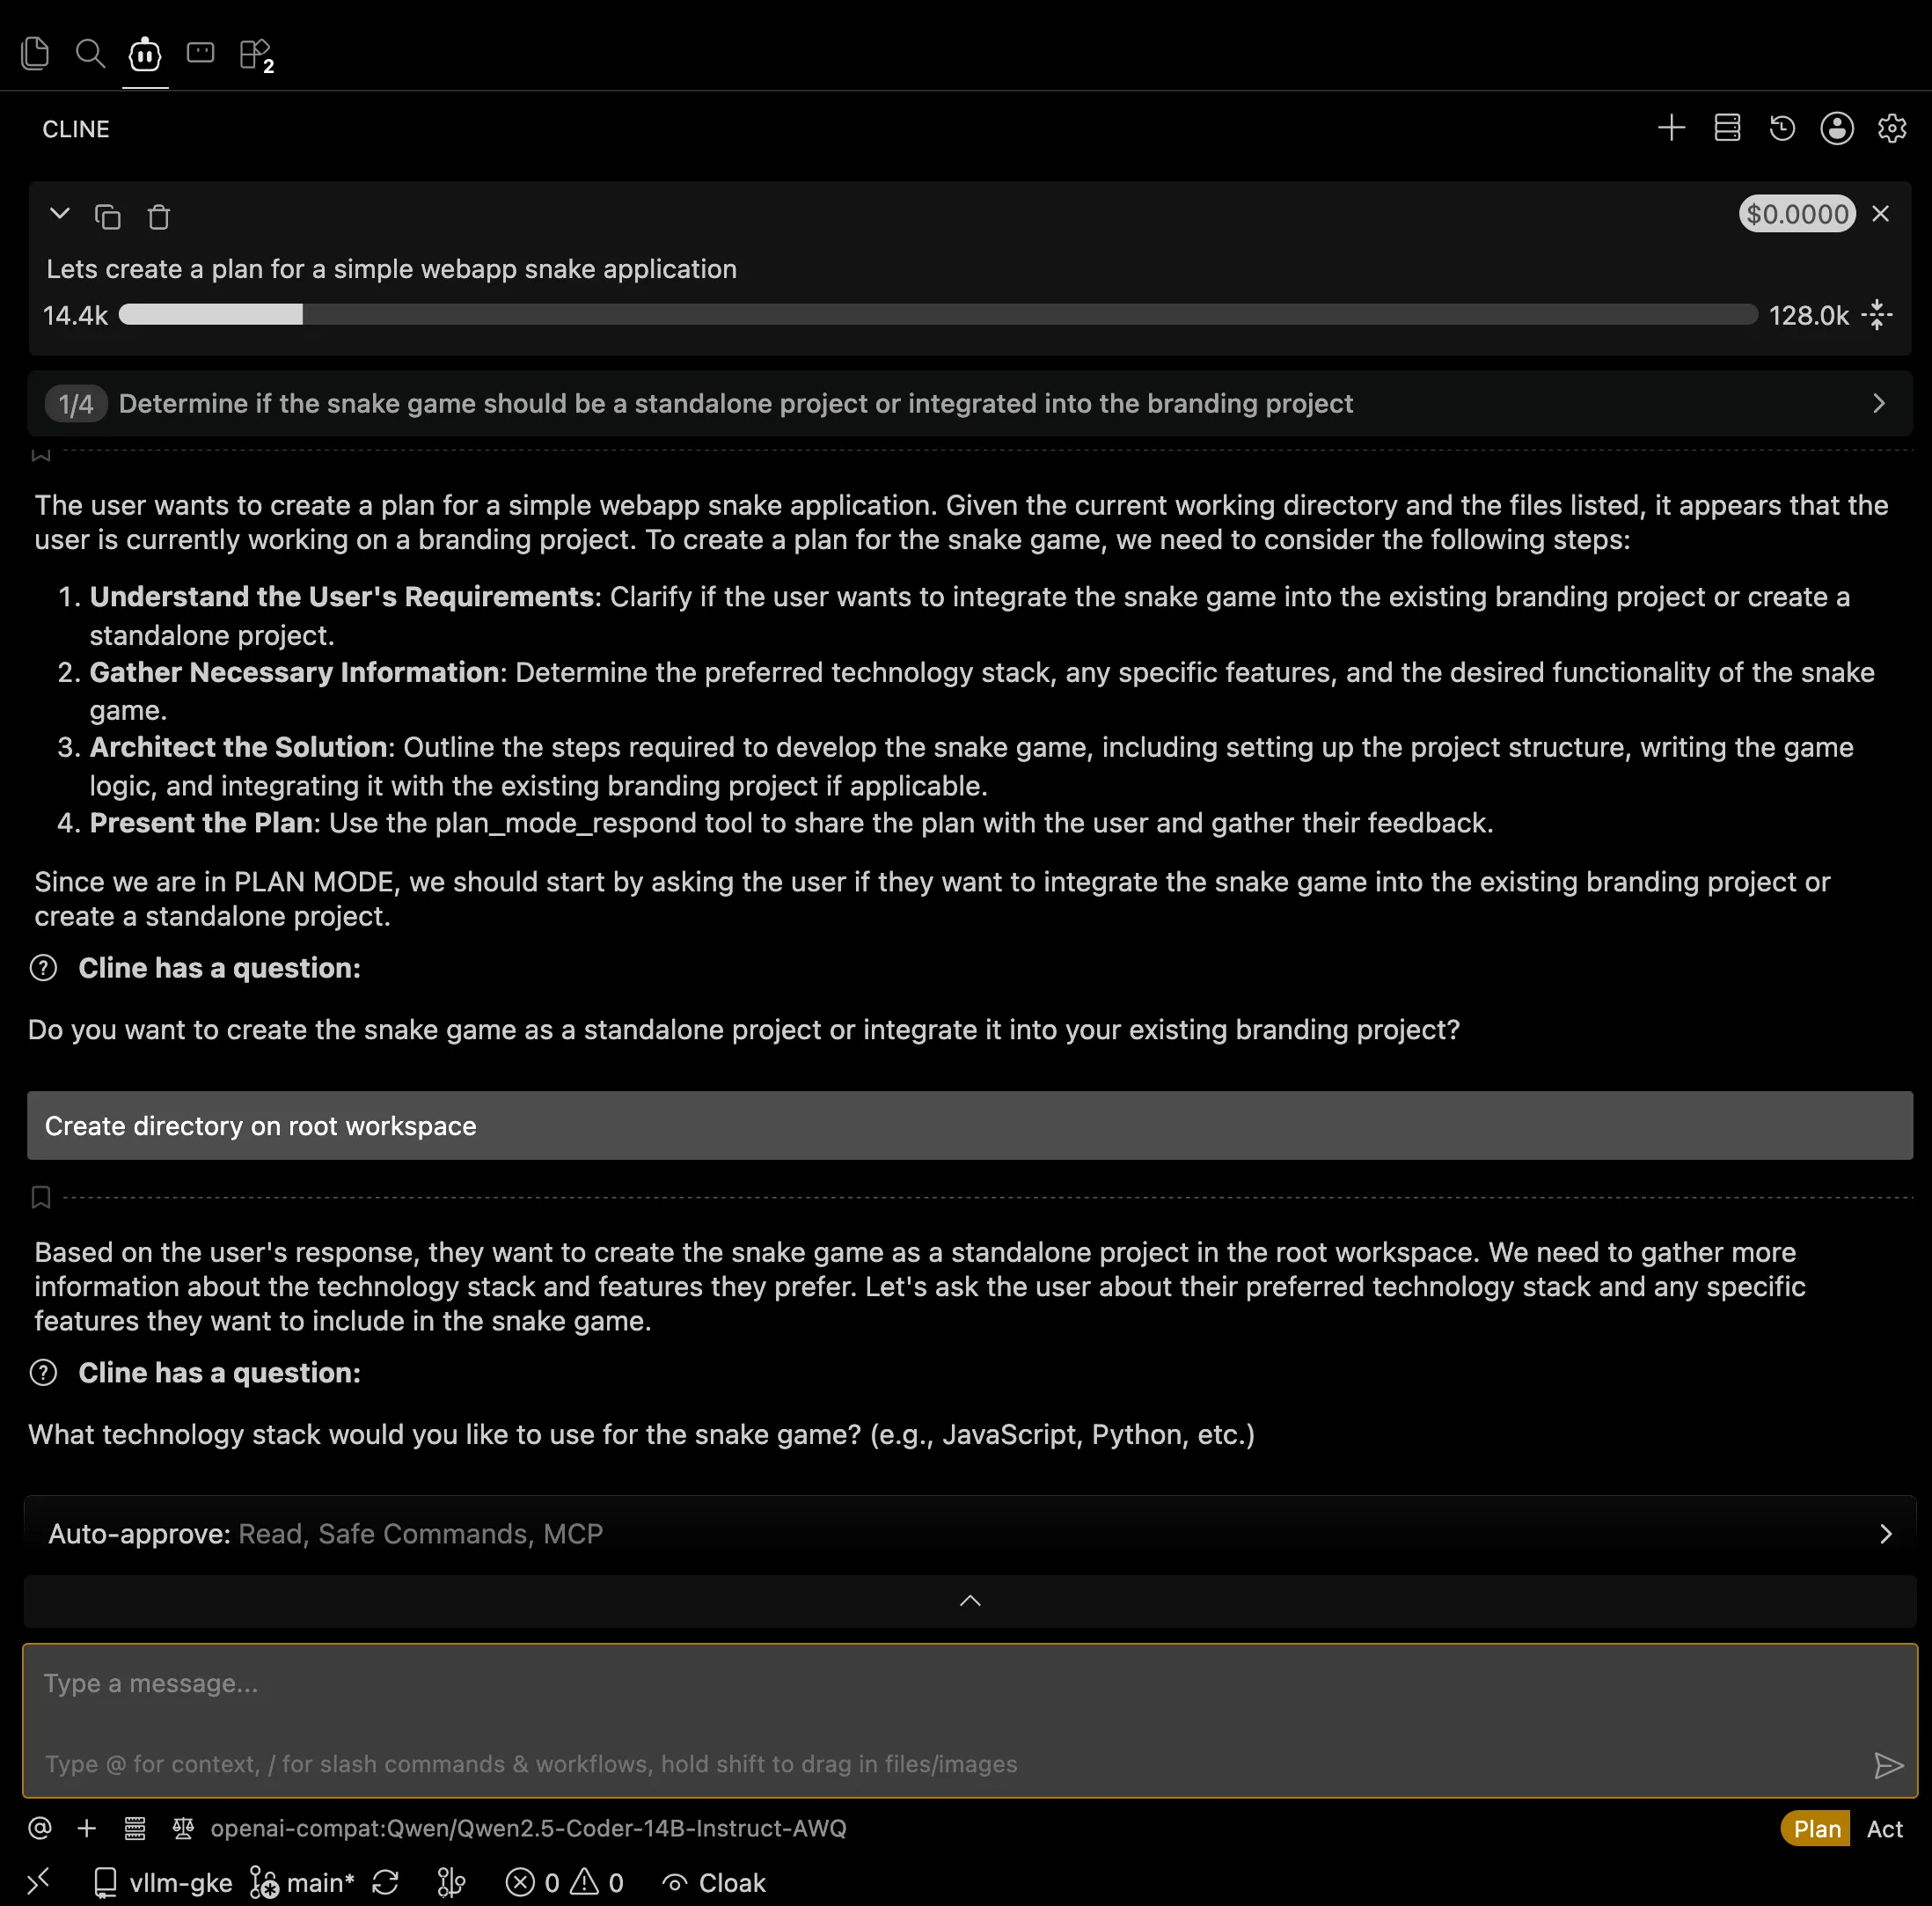
I then used the same Cline configuration from the previous article.
Sending another request means waiting again, since the GPU was terminated. With Cline, it will fire the request and wait for a response from my cluster.
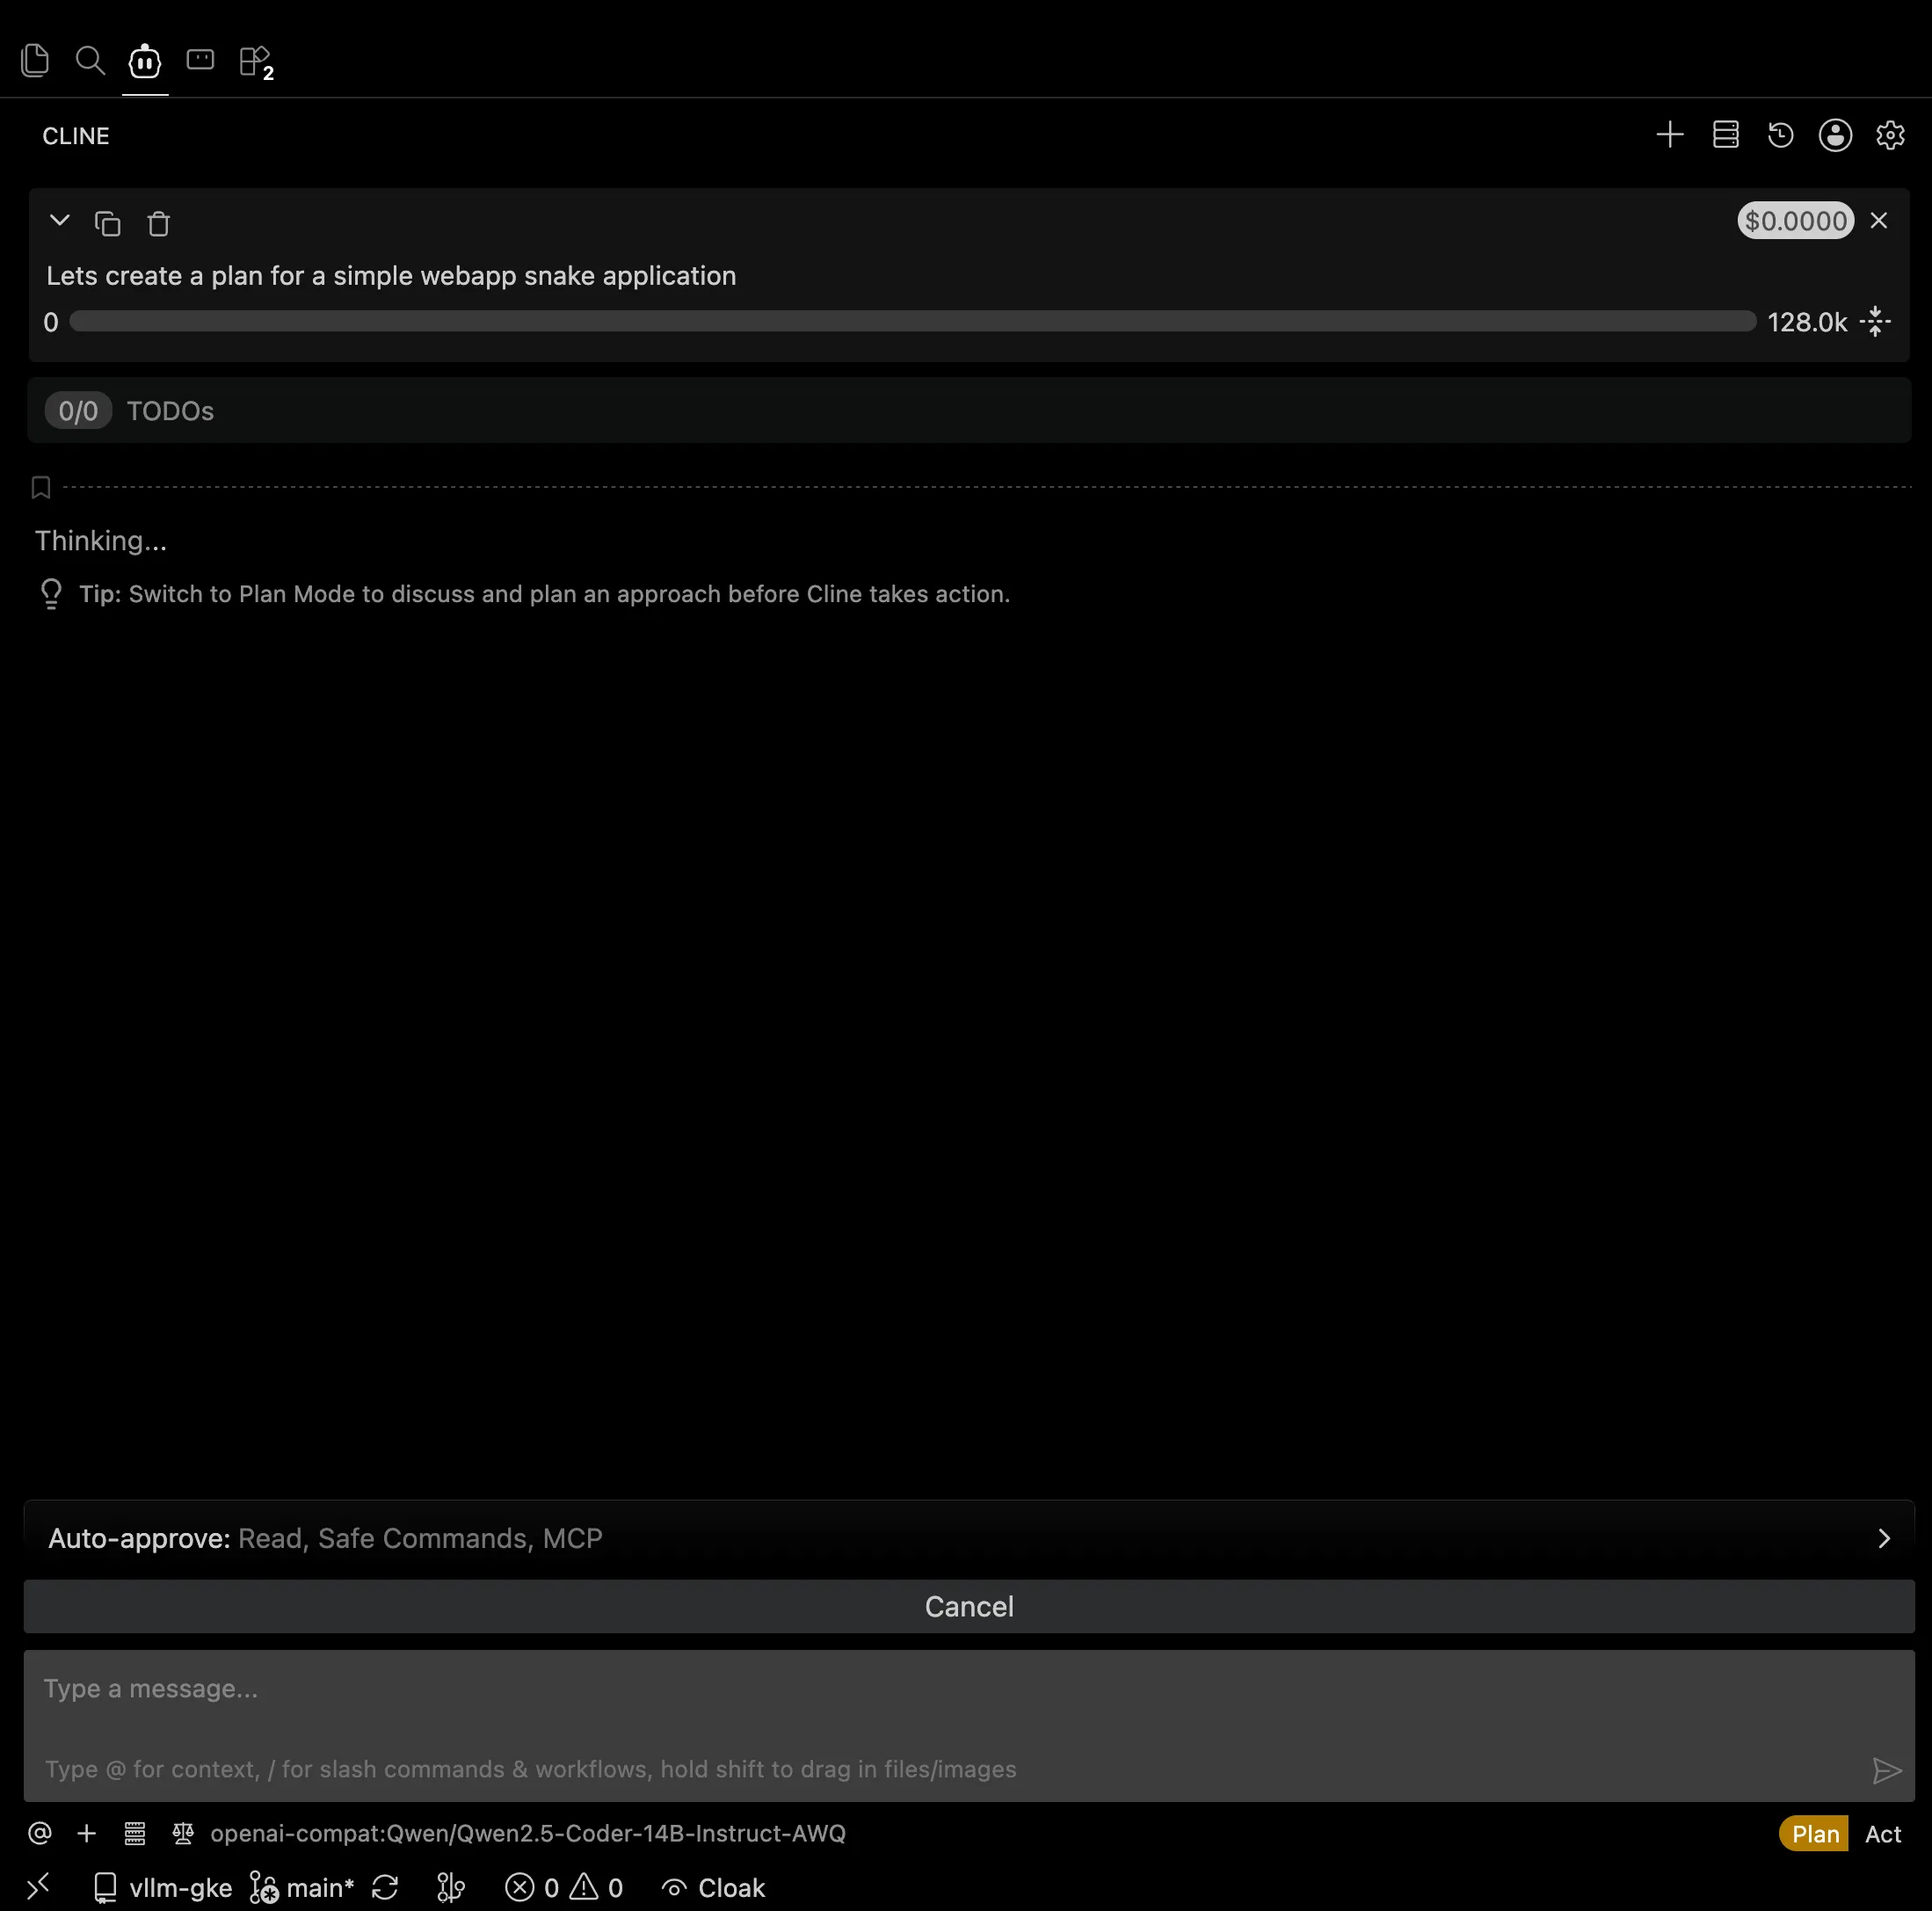

Once the machine is ready, the response is fetched from vLLM, and it can answer immediately for the next prompts since the machine is warm. Leaving the GPU without requests for 5 minutes scales the machine down again as expected.

Gotchas and final thoughts
A companion like Cline will time out its requests after 3 attempts. Nine times out of ten I had the GPU start from the first request, but I can hit errors or GPU outages as usual. In that case Cline times out, and the gotcha is that these requests stay pending on the HTTP interceptor, blocked until the deployment is fixed. Take care to drain the queue or freeze the scaling after several failed requests, because they will stay queued. If scale-to-zero is required in a production environment, this behavior weakens the HTTP add-on: it should be accompanied by a maintenance mechanism for queue operations and scaling, for example killing or respawning machines when the strategy gets out of sync. It is also worth explicitly highlighting that the HTTP add-on is still in beta and not fully mature for production. While it serves perfectly as a proof of concept for personal use, an enterprise-grade environment would either require a more robust alternative without such enrichments or rely on complementary tools to make it truly production-ready.
What is brilliant about KEDA is that it gives you the hand to choose your own strategy and custom-tailor it to the behavior you need. The same tool used in this scale-to-zero example works with availability constraints on a production-grade stack, and it can be enriched with cron metrics and machine metrics. That gives a wide variety of customization for a rich catalog of use cases.