vLLM Scale-to-Zero on GKE: KEDA Meets Datadog
Note: This article is a continuation of my previous post, Scaling vLLM to Zero with KEDA on GKE. The full source code for the architecture described below is available in the vllm-gke repository on the
proxy-datadog-scalingbranch.
On my vLLM GKE stack, I wanted to add metrics monitoring and keep a close eye on what happens inside the vLLM server. Monitoring is especially important when you host AI workloads on GPUs, for several reasons:
- Size machines and tune performance based on real usage
- Detect issues faster through metric symptoms and custom indicators
- Get a centralized view of what is happening across GPUs and servers
These points are almost mandatory when hosting AI workloads, both for cost optimization and for a better user experience.
Datadog is one of the best known solutions for cloud asset monitoring. It is appreciated for its easy setup and intuitive approach, and it gives teams the right tools to build a solid monitoring strategy. Its offering keeps growing, especially around Kubernetes monitoring and AI related capabilities.
I recently signed up for a trial and tested it on my stack. The goal was twofold: explore Datadog's Kubernetes monitoring features, and build a dedicated dashboard with custom metrics collected directly from the Prometheus endpoints of my stack.
I also pushed the proof of concept further by moving the scaling logic from the KEDA HTTP Add-On to the KEDA Datadog scaler, which gives better visibility on pod presence and overall usage.
Everything described below is implemented in the vllm-gke repository, on the dedicated branch proxy-datadog-scaling.
Datadog monitoring features
With Datadog, several areas of the platform help monitor a Kubernetes stack:
- A dedicated Kubernetes page, with:
- An Overview tab summarizing the clusters under monitoring
- An Explorer tab that deep dives into nodes, pods, network configuration, storage, and more
- An Autoscaling tab offering autoscaling capabilities based on custom strategies and the metrics collected during monitoring (best suited for asynchronous or long running workloads)
- A Remediation tab: when the Datadog Agent is present on a workload, it reports its health and can trigger defined remediation actions to restore unhealthy workloads
- A Rollouts tab with customizable deployment and rollout strategies
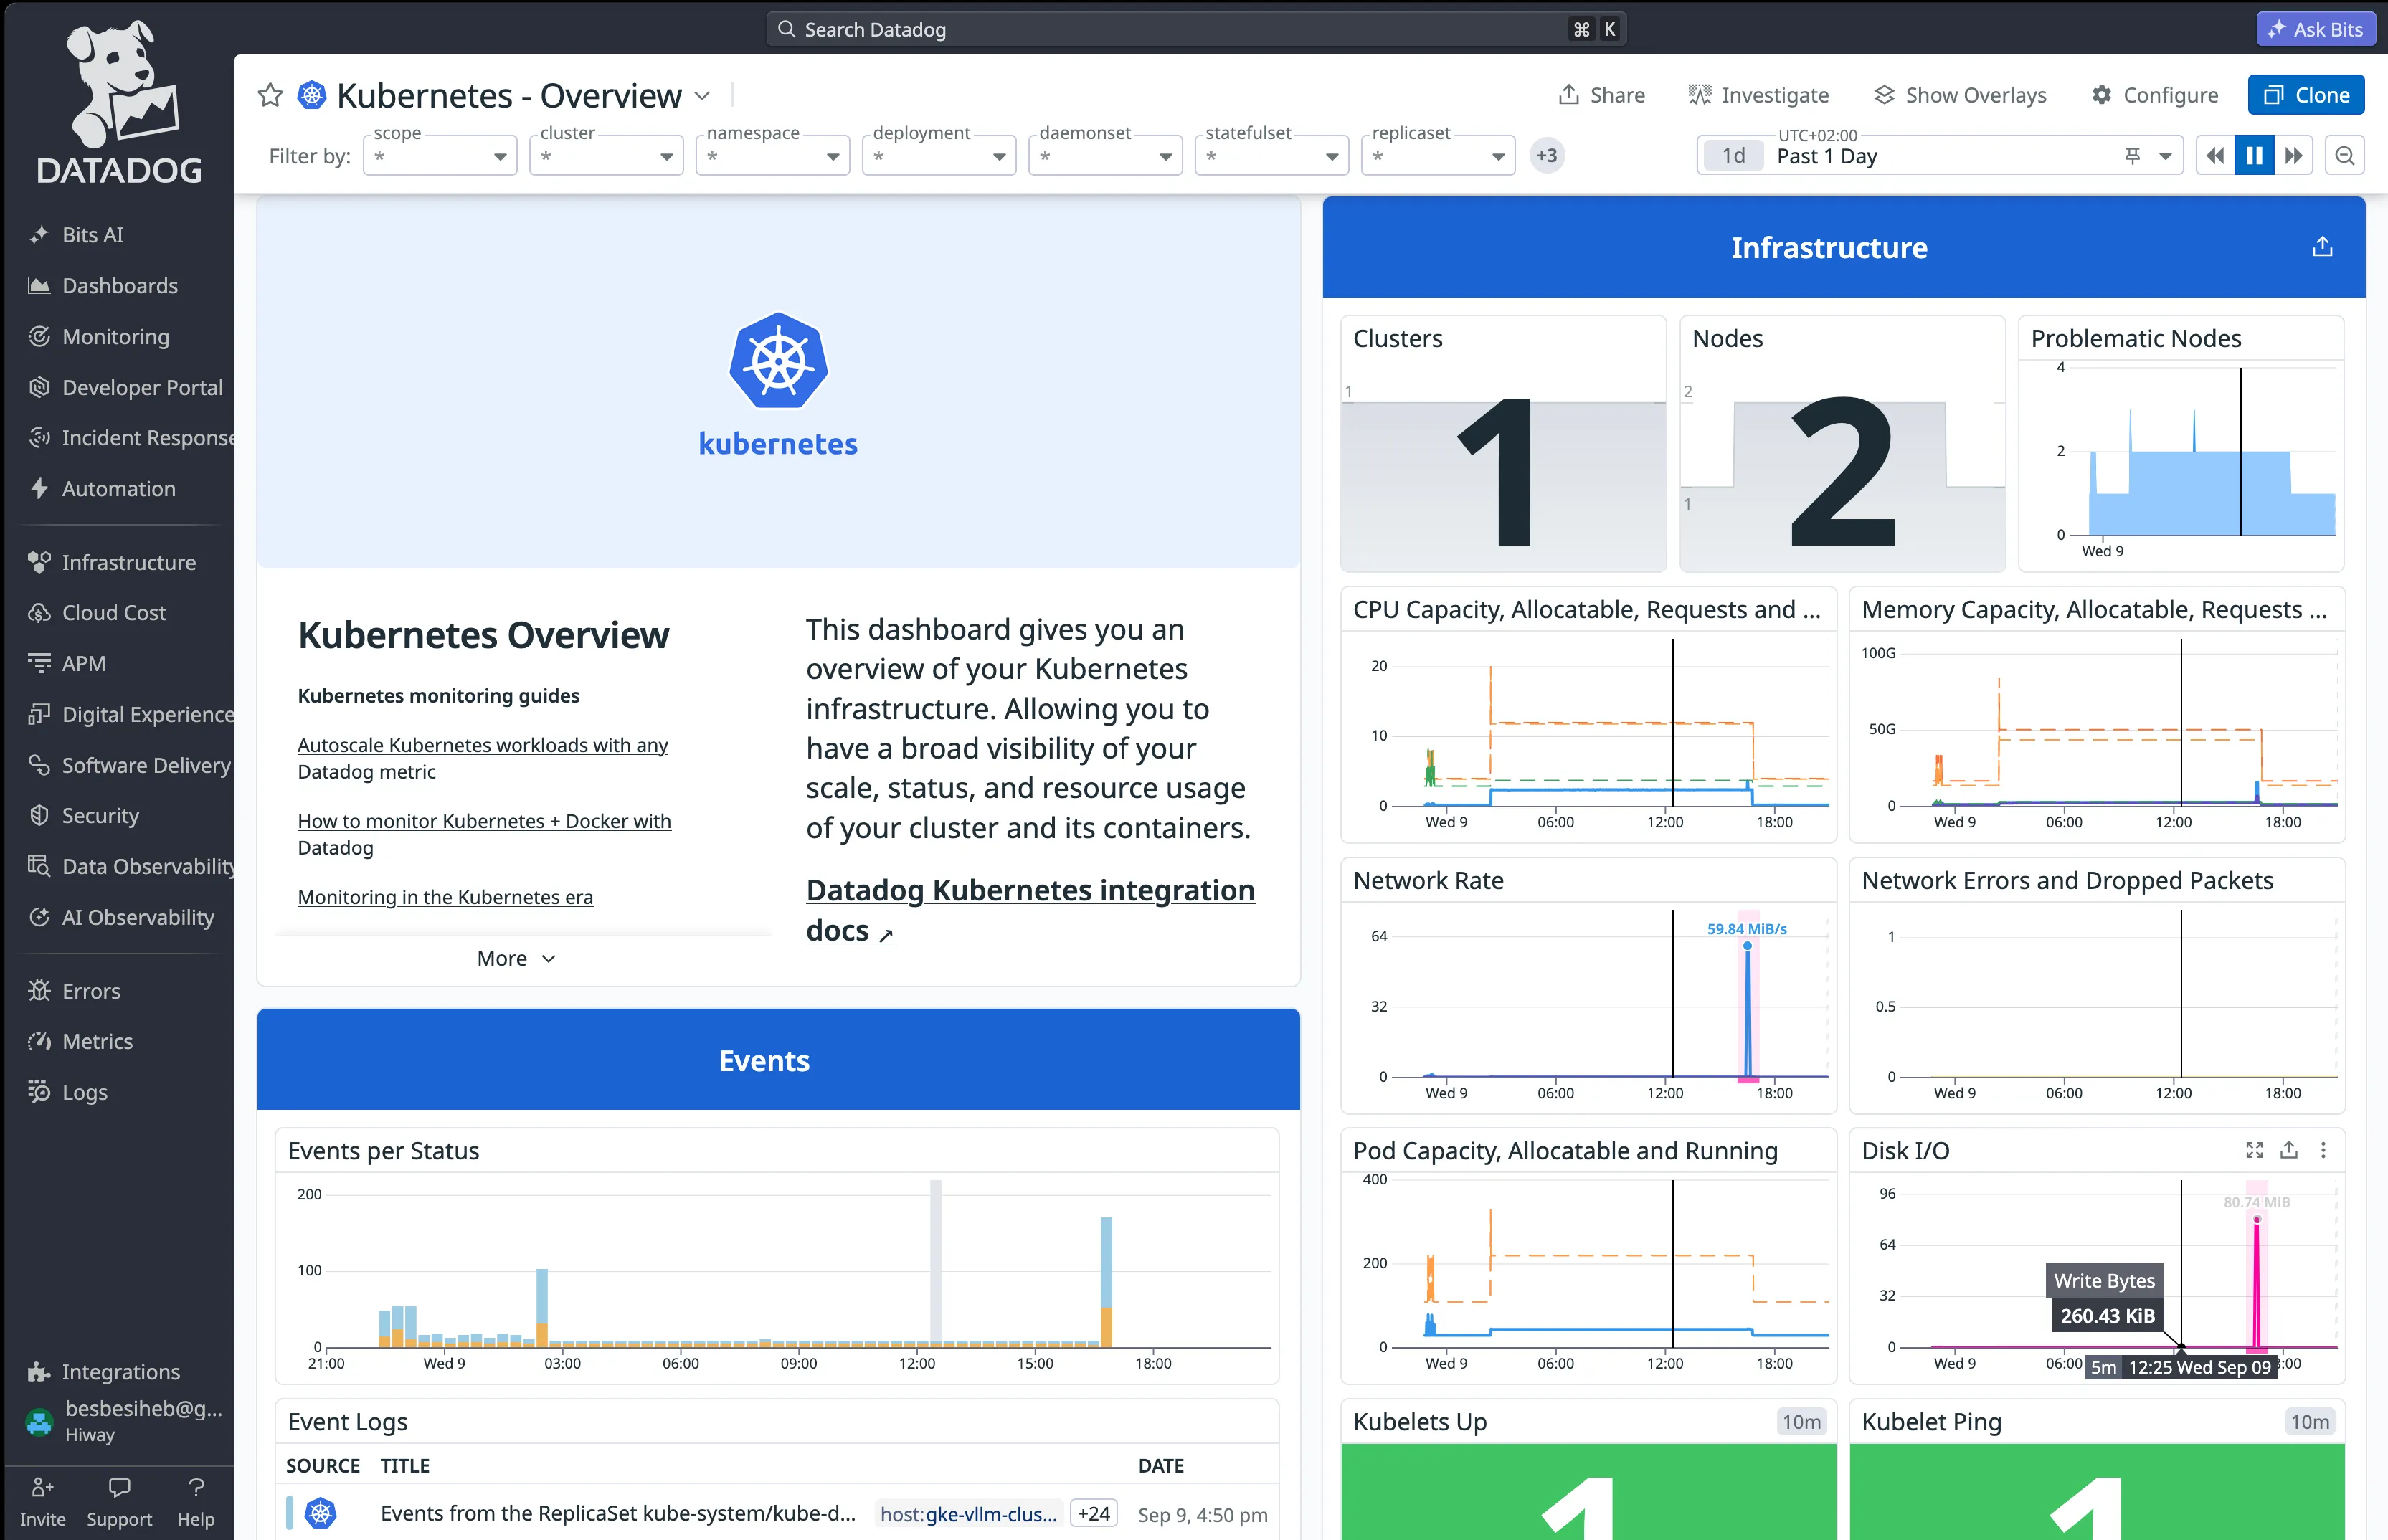
- A managed overview dashboard, automatically generated, that follows all the scraped Kubernetes metrics with several monitored sections and a metric filtering system
- Daily email digests with metrics and warnings about important events
- Many other explorable assets, plus a dedicated metrics page to discover and query them
Connecting the Datadog Agent
Metric collection on Datadog is straightforward. It relies on a dedicated agent running inside the cluster, which collects the metrics exposed by annotated workloads on their /metrics endpoint.
Prerequisites
- A Datadog account with access to an API key (also available on the trial)
- The Datadog Agent installed and running in the cluster
- Annotated workloads that expose metrics
Once these conditions are met, metrics become available in Datadog almost instantly. You can explore them through the managed assets described above or through custom dashboards.
API key
- Log in to your Datadog account.
- Go to Organization Settings -> API Keys.
- Create a new key (or copy an existing one).
Agent installation
Export your API key as an environment variable, then run the installation script provided in the repository. The script installs the Datadog Helm chart and enables prometheusScrape, so the agent automatically picks up the vLLM metrics.
Install the Datadog Agent
Behind the scenes, the script runs:
Helm install command
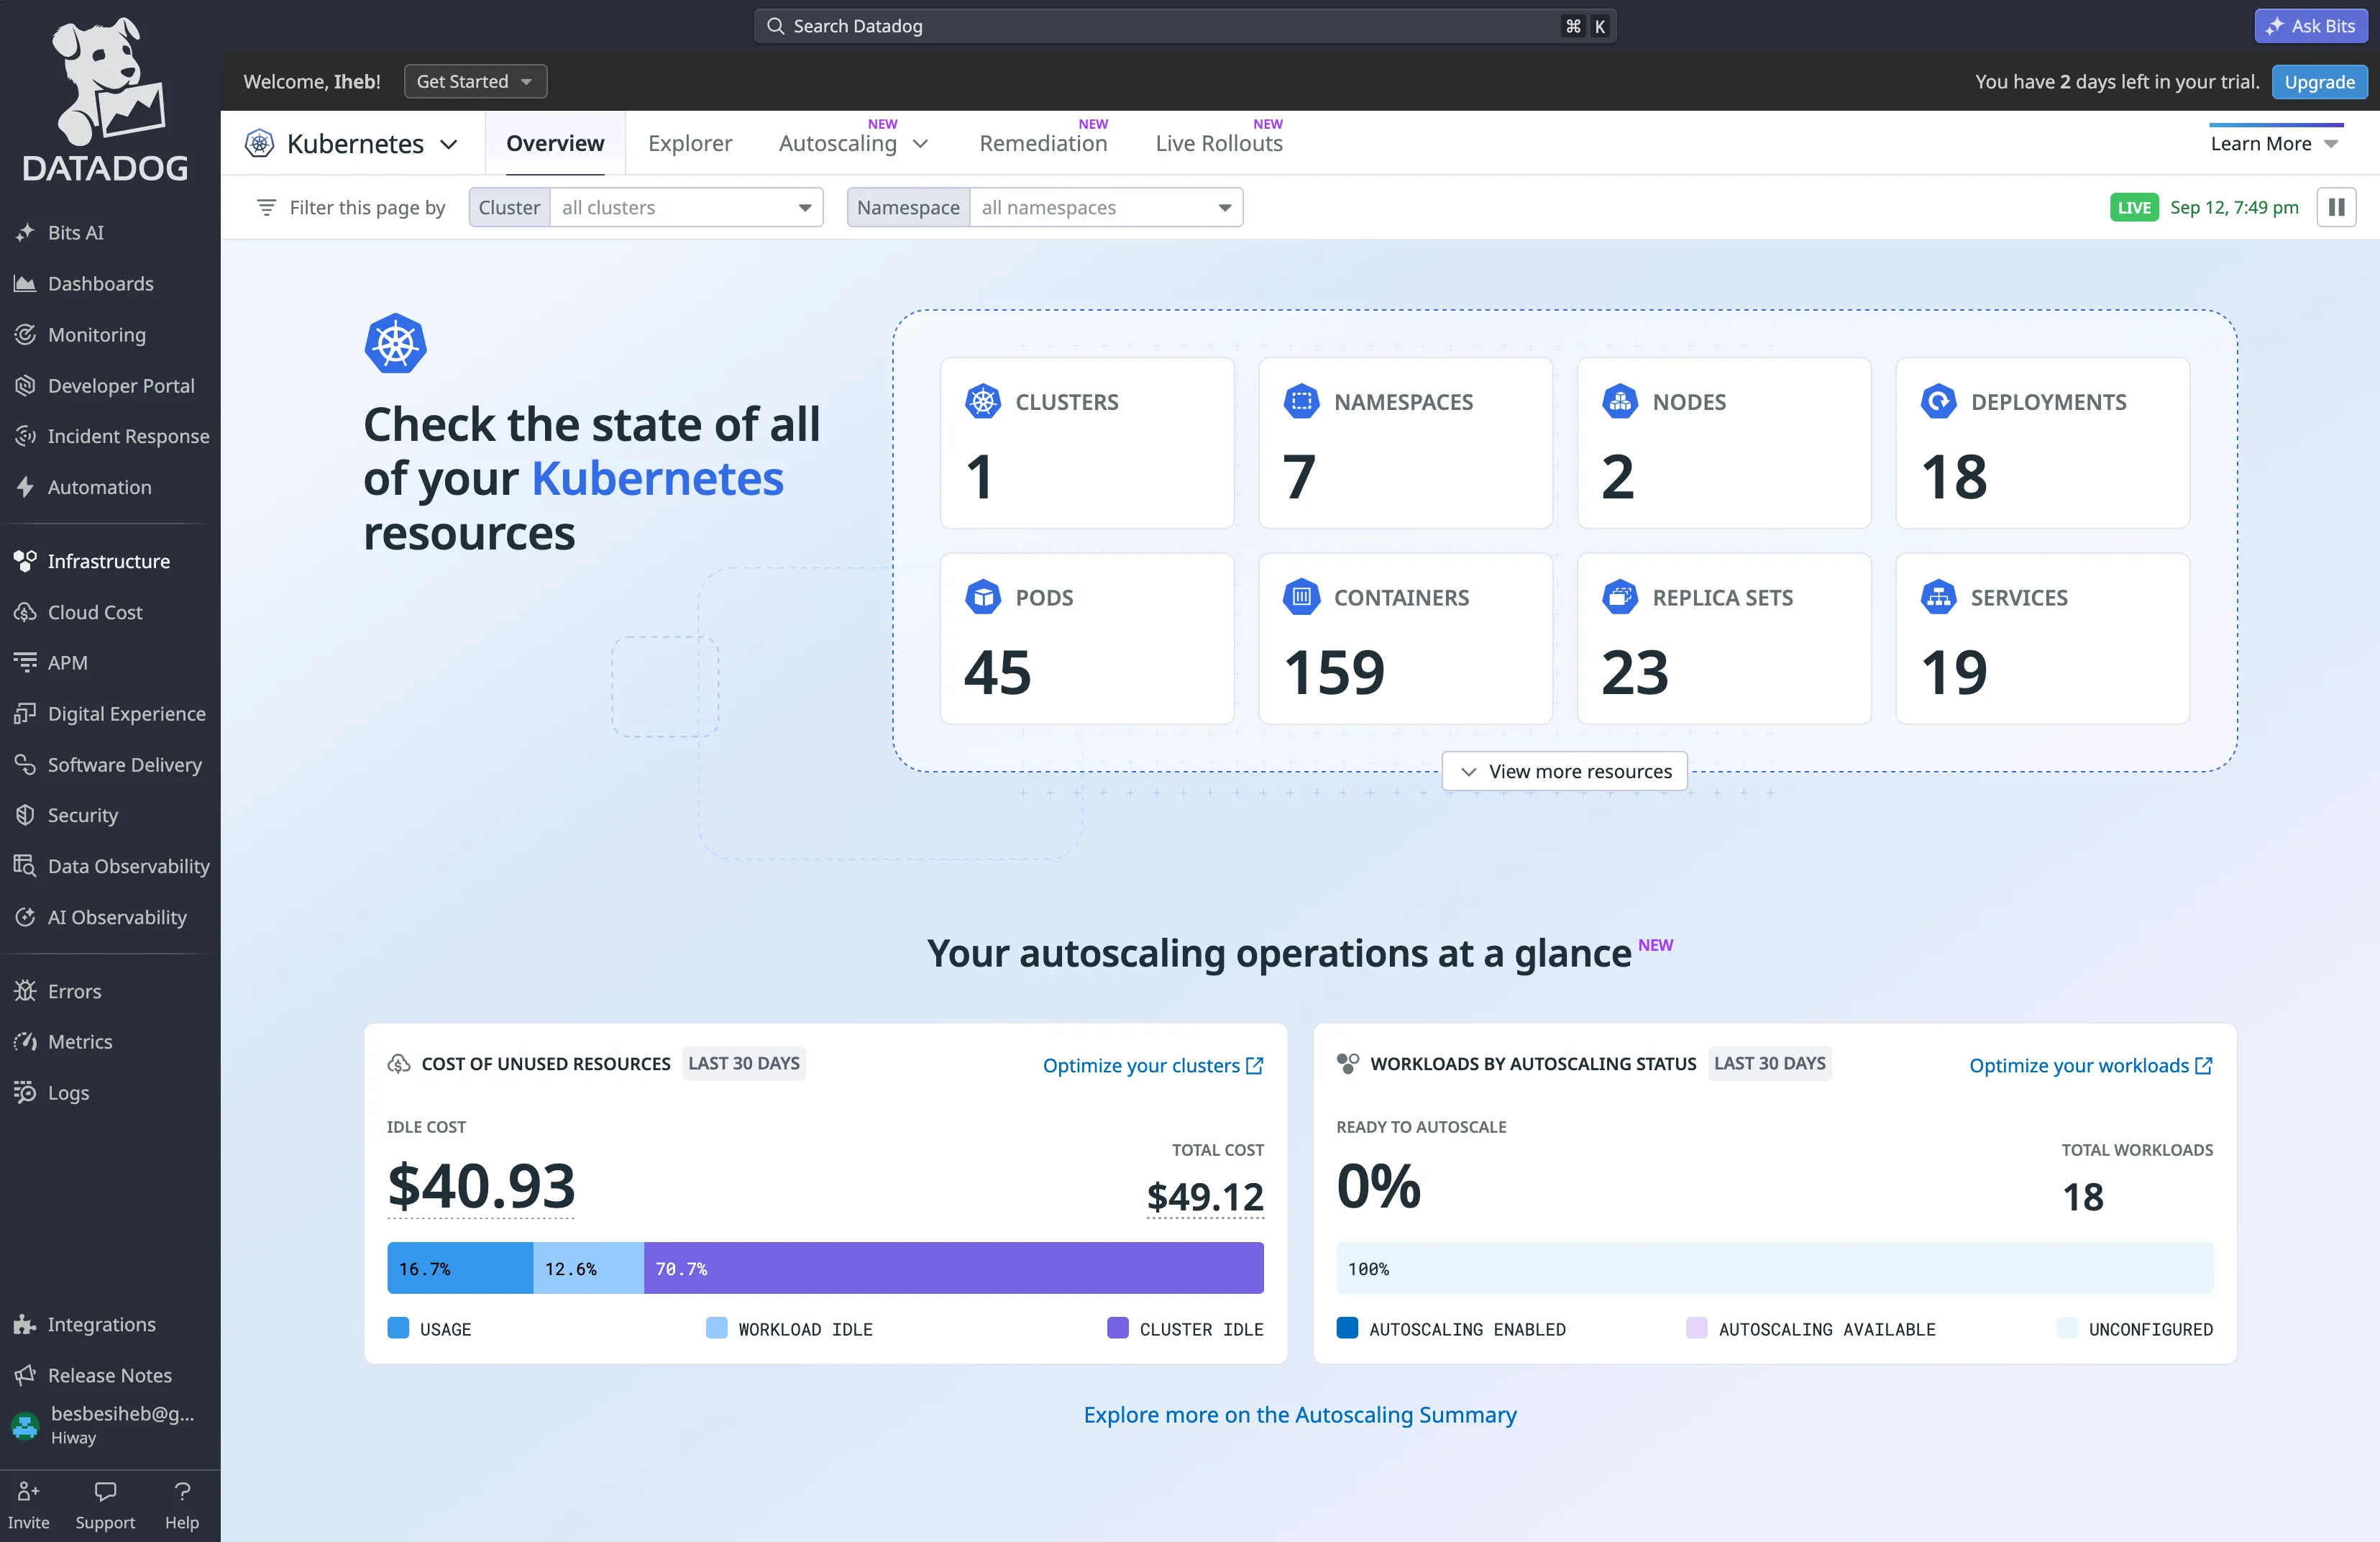
Once everything is deployed, metrics become visible in Datadog. Here is an example of the Overview page described above:
More metrics are available on the managed overview dashboard generated automatically:
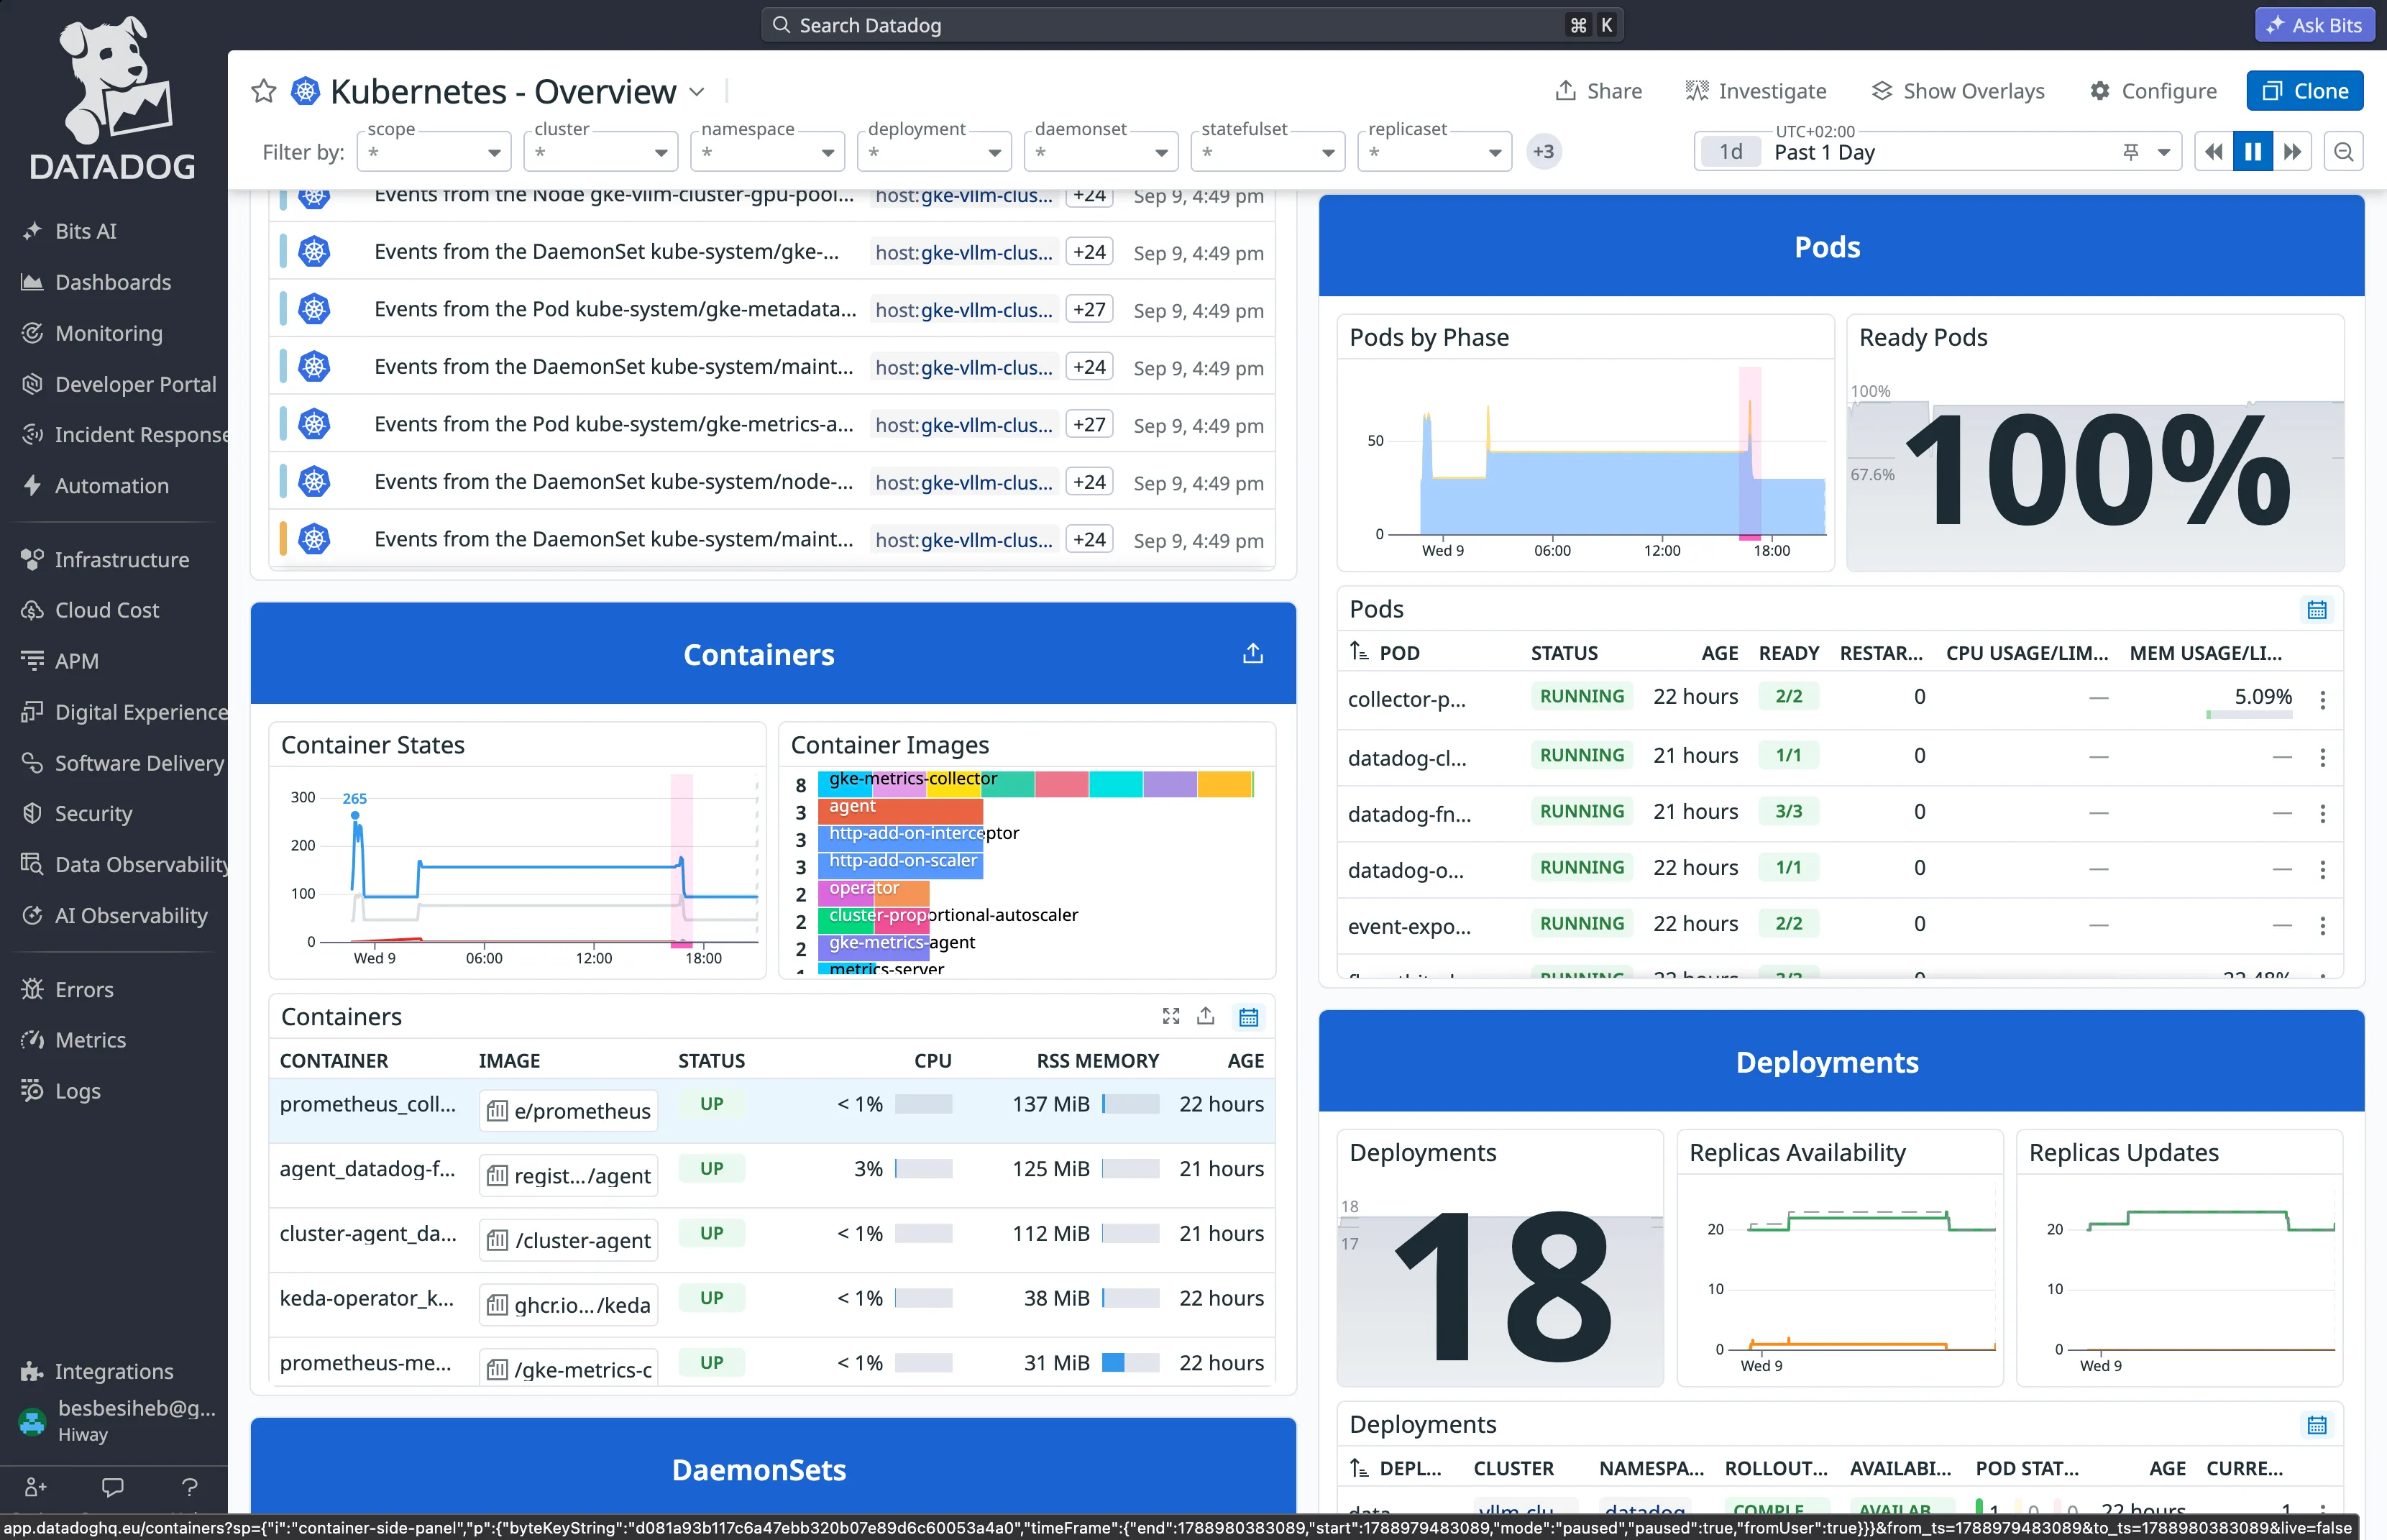
These views can be explored further to build custom widgets and boards that match your monitoring expectations.
Scraping vLLM metrics
Beyond the cluster level metrics, I was really interested in what happens inside the vLLM server itself. Since prometheusScrape was enabled during the agent installation, the Datadog Agent can already collect Prometheus metrics. I only had to tell it where to find the vLLM metrics, using an annotation on the vLLM server deployment in the Helm chart. It then scrapes all the exposed metrics:
vLLM OpenMetrics annotation
This is very easy to put in place. In practice, choosing which metrics to monitor and designing the dashboard layout took more time than connecting the cluster itself. My goal was to track what happens inside the vLLM server, so I focused on latency, time to first token (TTFT), internal queueing, and similar metrics.
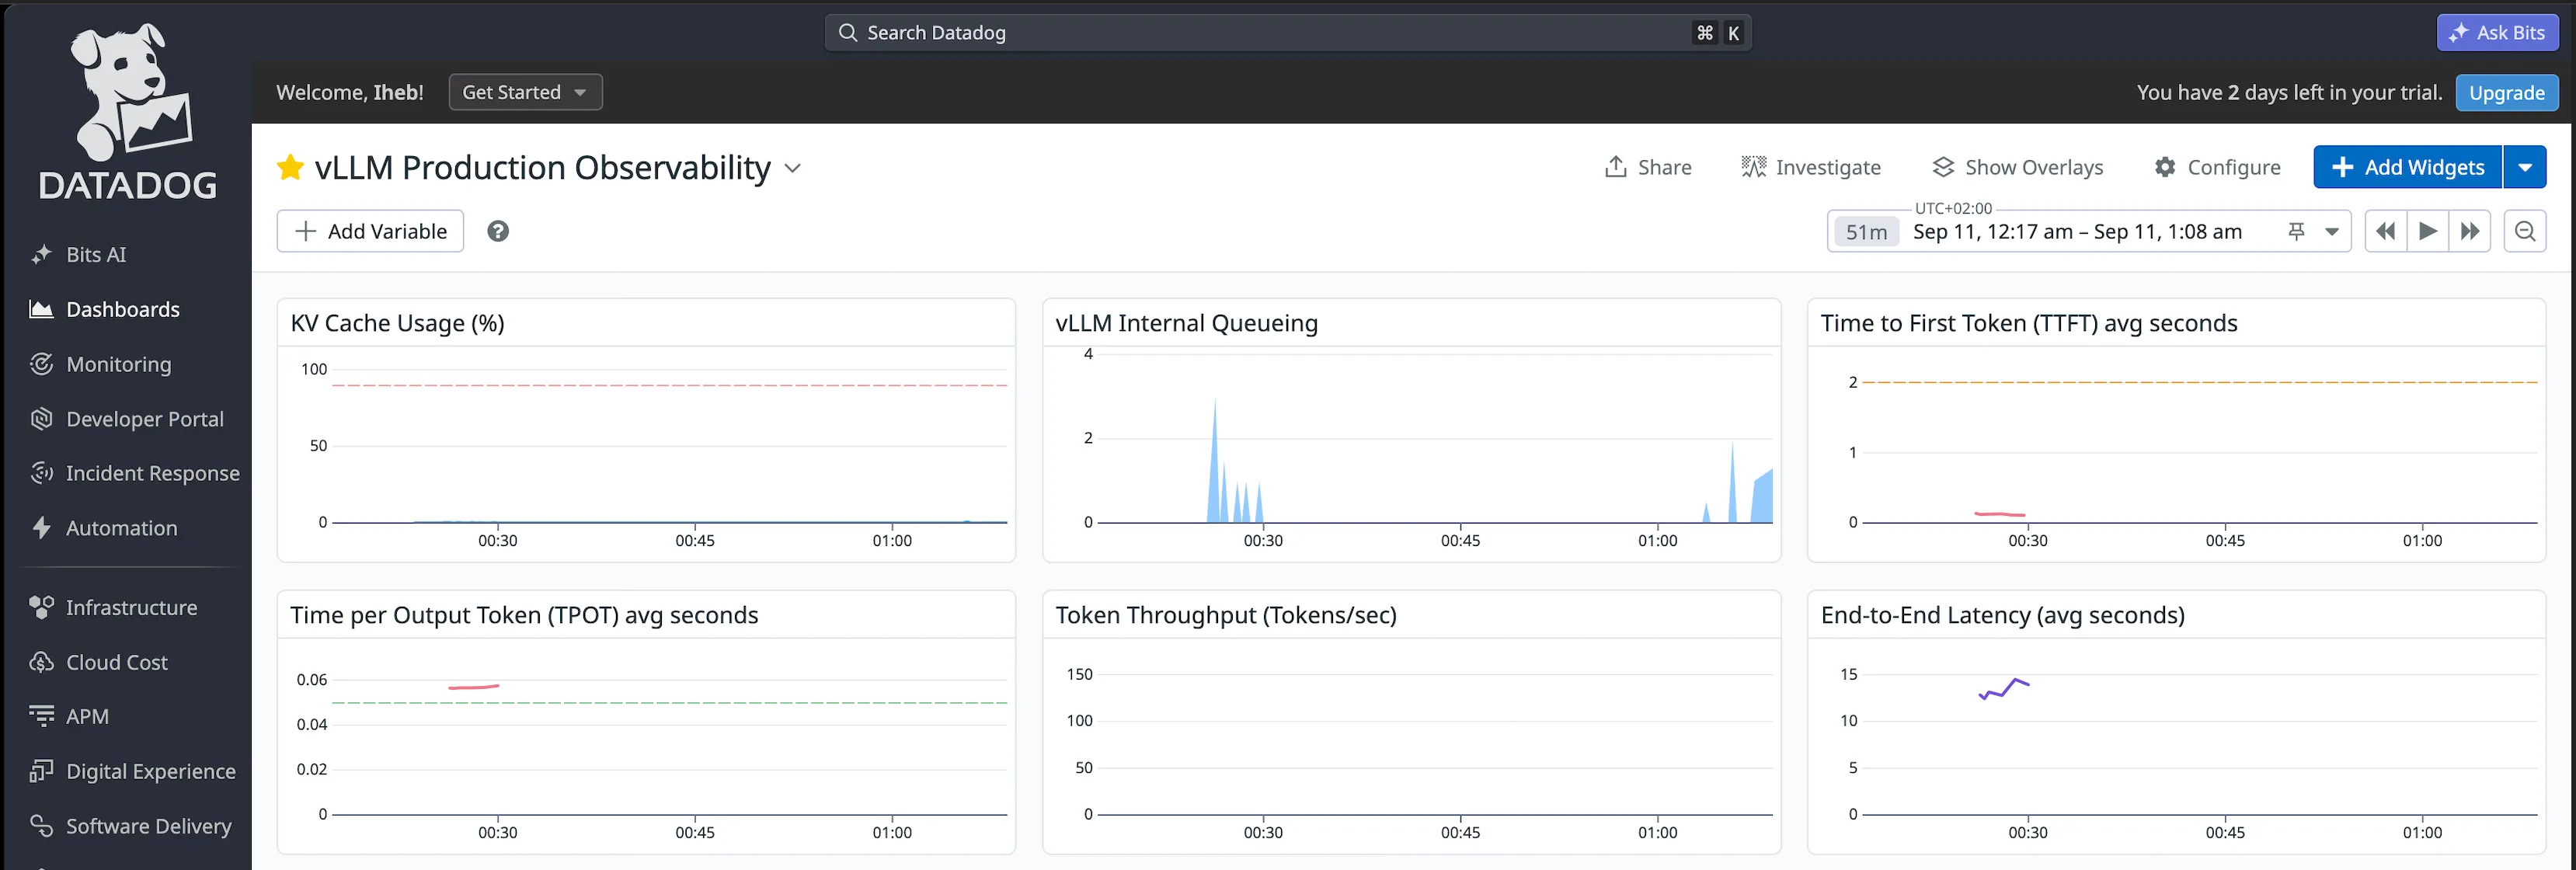
These metrics change with usage. They are important to understand the overall load on the server and how it processes requests. Scraping is not real time, but it is close enough: the agent updates the metrics at a regular interval, so at any moment I can read the values I am looking for.
The diagram below summarizes how the metrics flow from the workloads to Datadog:
The whole setup experience was easy and fully doable on the Datadog trial. Within a few days of activating the trial, I had connected the cluster and built a custom dashboard. This left me free to focus on strategy: which metrics to export and how to exploit them.
Scaling with the Datadog scaler
I also wanted to explore Datadog's autoscaling feature. It works out of the box, with ready to use procedures to scale Kubernetes workloads up and down based on many metrics. However, it is better suited to asynchronous stacks.
My goal here is scale to zero, so I face the same constraint covered in my previous article: when the stack is scaled to zero, nothing is running to register incoming calls. vLLM cannot know that requests are coming if it is not provisioned and up. I previously solved this with the KEDA HTTP Add-On, which was still in beta but elegantly scaled the stack based on its internal pending requests metric.
Adding a queue or an entry point in front of the stack would solve the problem immediately, and I could even use the Datadog scaler directly. But the stack would no longer be synchronous, which would complicate communication with code assistant companions that rely on synchronous exchanges with the AI cluster.
Some solutions suggest a cron based approach, then scaling on incoming requests. With custom metrics, Datadog allows something better.
The idea is to create a custom metric that represents the number of active requests on the vLLM server and push it to Datadog. This solves the constraint nicely. However, since a vLLM pod takes several minutes to provision its GPU, the first request would be dropped before anything is ready. The KEDA HTTP Add-On and Knative solve this solve this with an interception layer that sits between the client and the server: it holds requests until the backend has scaled up and is ready to serve.
I can achieve the same result with a custom interceptor that reports a custom metric to Datadog. The flow looks like this:
- The proxy receives an incoming call and holds it
- It exposes the number of active requests as a Prometheus gauge
- The Datadog Agent scrapes this gauge and pushes it to Datadog
- The KEDA Datadog scaler polls the metric from the Datadog API
- KEDA scales the vLLM deployment accordingly
- Once the pod is ready, the proxy forwards the held request to the vLLM server
The best thing about this approach is that the stack is now monitored and scaled through Datadog, from a single centralized point. At production scale, with multiple clusters, everything can be managed in one place. Compared with the HTTP Add-On approach, there is a small added latency, because the scaling signal now round trips through Datadog instead of being decided inside the cluster. This latency is minimal, and easy to accept once everything is bundled in the same dashboard. To make it work, I added a small always on proxy server that listens for incoming requests and reports them, so that a scaling decision can be taken when needed.
Note the two directions of the data flow: the Datadog Agent pushes metrics to Datadog, while the KEDA operator pulls metrics from Datadog to make scaling decisions.
KEDA authenticates with both a DD_API_KEY and a DD_APP_KEY (application keys are 40 characters). They are mapped securely through a Kubernetes Secret and a TriggerAuthentication resource:
KEDA TriggerAuthentication
The custom reverse proxy (vllm-proxy) exposes a Prometheus gauge named vllm_proxy_active_requests.
The Datadog Agent scrapes the proxy thanks to an annotation on the pod in proxy-deployment.yaml:
Proxy scrape annotation
With these new metrics, I could complete my dashboard with more usage widgets:
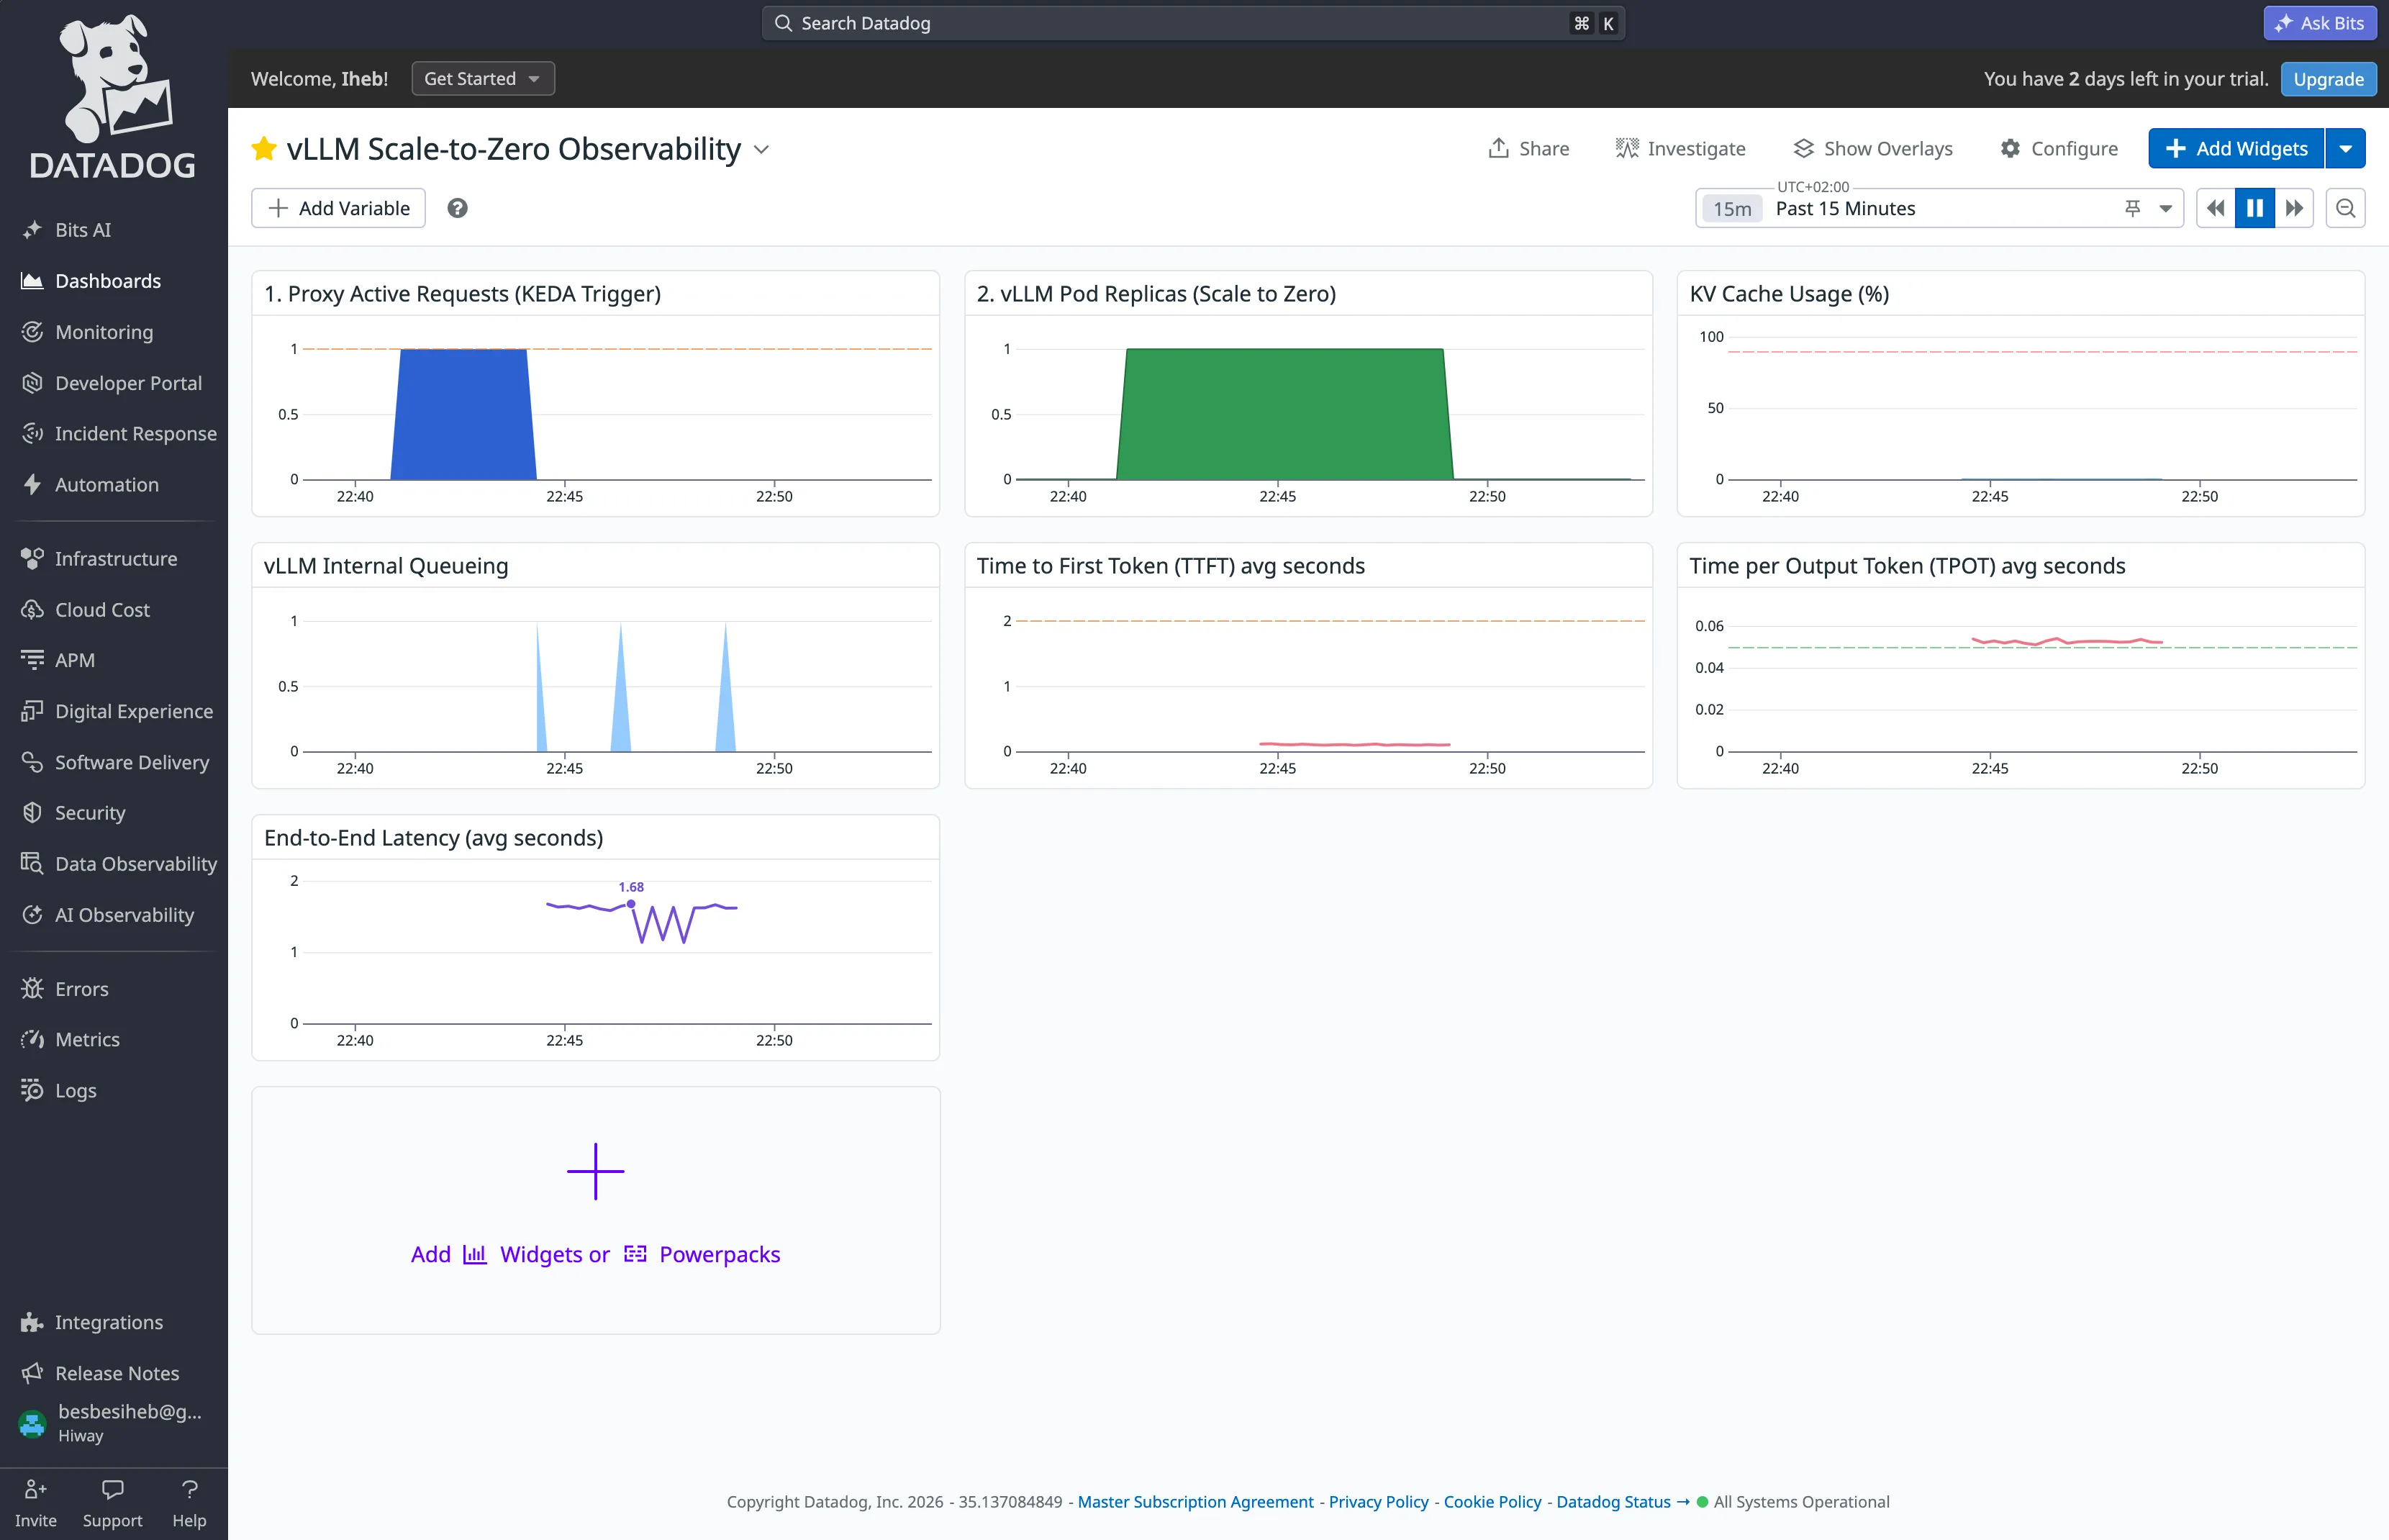
The widgets show the active proxy requests and the GPU pods. As soon as a request arrives, the proxy holds it for several minutes while the pod provisions the GPU and starts responding. About five minutes after the last activity (the default KEDA cooldownPeriod of 300 seconds), the pod scales down and the other metrics stop, since the GPU has been released. This gives a direct visual representation of request driven scale out and scale in on this cluster.
Dashboard source code
vLLM Scale-to-Zero Observability dashboard
Conclusion
Overall, onboarding Datadog and connecting its agent to my cluster was a very easy experience. It is a solid solution that keeps adding features aligned with current and future AI trends. Beyond the scaler, the remediation feature is very interesting, as are the native AI capabilities, which can even detect hallucinations. For production contexts with multiple Kubernetes stacks under heavy load, Datadog brings real value: eagle eye monitoring capabilities, plus some control over scaling and rollouts.